Traders Latitude

aditya bothikar

100 Stock Market Questions Answered

  📈 Updated 2024 100 Most AskedStock Market & Trading Questions — Answered The definitive FAQ for traders and investors at every level. From your first trade to advanced strategy — no fluff, just answers. 100Questions 10Categories All LevelsBeginner → Advanced 📘 Basics ⚔️ Strategies 📊 Technical Analysis 🔍 Fundamental Analysis 🛡️ Risk Management 🧰 Instruments 🌐 Macro & Economy 🏦 Accounts & Tax 🧠 Psychology 🚀 Advanced 📘 Stock Market Basics Q1 – Q15 1What is the stock market?▼ The stock market is a marketplace where buyers and sellers trade shares of publicly listed companies. It includes exchanges like the NSE & BSE, and serves as a key mechanism for companies to raise capital and for investors to grow wealth over time. 2How do I start investing in stocks?▼ To start: (1) Set a financial goal, (2) Open a brokerage account, (3) Fund it with money you can afford to invest, (4) Research stocks or index funds, (5) Start small and diversify. Many brokers offer Low brokerage trades for beginners. 3What is a stock?▼ A stock is a unit of ownership in a company. When you buy a stock, you become a partial owner (shareholder) and may benefit from its growth through price appreciation and dividends. 4What is the difference between stocks and bonds?▼ Stocks represent ownership in a company — higher risk, higher potential return. Bonds are loans you give to companies or governments in exchange for regular interest payments — generally lower risk, lower return. 5What is a bull market?▼ A bull market is a period when stock prices are rising or expected to rise, typically 20%+ from recent lows. It reflects investor optimism, strong economic growth, and high demand for equities. 6What is a bear market?▼ A bear market is a period of falling prices — generally 20% or more from recent highs. It often signals economic slowdown, low investor confidence, and widespread selling pressure. 7What is an ETF?▼ An Exchange-Traded Fund (ETF) is a basket of securities — stocks, bonds, or commodities — that trades on a stock exchange like a single stock. ETFs offer diversification, low costs, and flexibility, making them popular for beginners and experts alike. 8What is a mutual fund?▼ A mutual fund pools money from many investors to buy a diversified portfolio of assets. It is managed by a professional fund manager and priced once per day after market close, unlike ETFs which trade throughout the day. 9What is the S&P 500?▼ The S&P 500 tracks the 500 largest publicly traded U.S. companies by market cap. It is widely considered the best single benchmark of U.S. stock market performance and the overall health of the American economy. 10What is a dividend?▼ A dividend is a portion of a company’s earnings paid out to shareholders, usually quarterly. Not all companies pay dividends — they are most common among large, stable companies in utilities, financials, and consumer staples. 11What is market capitalization?▼ Market cap = share price × total shares outstanding. Companies are classified as large-cap (>$10B), mid-cap ($2B–$10B), and small-cap (<$2B). Larger companies generally carry lower risk but less growth potential. 12What is an IPO?▼ An Initial Public Offering (IPO) is the first time a private company offers its shares to the public on a stock exchange. It allows the company to raise capital and gives early investors an exit opportunity. 13What is a stock split?▼ A stock split increases the number of shares by dividing each existing share. For example, a 2-for-1 split doubles shares and halves the price. The total company value doesn’t change — it just makes shares more accessible. 14What are blue-chip stocks?▼ Blue-chip stocks are shares of large, well-established, financially stable companies with long records of reliable performance. Examples include Apple, Johnson & Johnson, and Coca-Cola. They are considered lower-risk investments. 15What is the difference between the NYSE and NASDAQ?▼ NYSE is a traditional auction-based exchange with physical floor traders, focusing on large established companies. NASDAQ is fully electronic and known for listing technology companies. Both list thousands of stocks but differ in structure and culture. ⚔️ Trading Strategies Q16 – Q28 16What is day trading?▼ Day trading involves buying and selling within the same trading day, with all positions closed before market close. It requires fast decision-making, skill, and strict risk management. Most beginners lose money day trading. 17What is swing trading?▼ Swing trading holds positions for several days to weeks, profiting from short- to medium-term price moves. It requires less screen time than day trading while remaining more active than long-term investing. 18What is the difference between investing and trading?▼ Investing is a long-term approach focused on building wealth over years or decades. Trading seeks to profit from short-term price fluctuations. Investing requires less time and emotional discipline; trading demands constant attention and strict risk management. 19What is dollar-cost averaging (DCA)?▼ DCA involves investing a fixed amount at regular intervals regardless of price. This reduces the impact of volatility and removes the pressure of timing the market — one of the most beginner-friendly strategies. 20What is passive investing?▼ Passive investing means buying and holding diversified index funds or ETFs without trying to beat the market. It minimizes costs, reduces emotional decisions, and historically outperforms most actively managed funds over 10+ years. 21What is active investing?▼ Active investing involves frequent buying and selling with the goal of outperforming a benchmark. It requires research, timing, and monitoring. Most studies show active funds underperform index funds after fees over the long run. 22What is Warren Buffett’s investment strategy?▼ Buffett follows a value investing approach: buying high-quality businesses at fair or undervalued prices and holding long term. Key principles: competitive advantages (moats), strong management, predictable earnings, and avoiding excessive debt. 23What does “buy the dip” mean?▼ “Buy the dip” means purchasing a security after a price drop, betting the decline is temporary. It works well in bull markets but can be dangerous if the asset is in a genuine downtrend — dips can become deeper crashes. 24What is

100 Stock Market Questions Answered Read More »
How the Iran–US War Impacted India's Long-Term Economic Growth

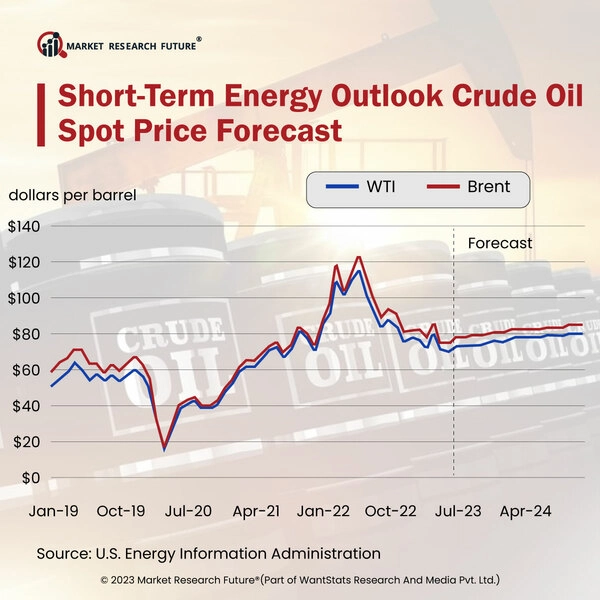
Iran-US War & India’s Long-Term Economic Impact | Traders Latitude 🔒 Secure Connection  |  SEBI Registered Research Analyst  |  Educational Content Only Traders Latitude SEBI RA Geopolitics & Markets · June 2026 How the Iran–US War Impacted India’s Long-Term Economic Growth Educational Analysis 12 min read Traders Latitude Research Desk When war broke out between the United States, Israel, and Iran on February 28, 2026, most Indian investors initially watched from a comfortable distance. Within days, however, the tremors reached every corner of the Indian economy — from the Surat diamond polishing belt to the trading terminals of Dalal Street, from petrol pumps in Kanpur to the bank accounts of 9 million Indian workers in the Gulf. This article examines the real, data-backed impact of that conflict on India’s economic trajectory — and what it means for long-term growth. $120 Brent Crude peaked (per barrel) from $80 pre-war 5.9% Goldman Sachs revised India GDP forecast (down from ~7%) ₹34K Cr FII equity selloff in India in just first 2 weeks of March 2026 ₹94 Rupee breached vs dollar, a fresh record low $51.4B Gulf remittances at risk from India’s 9 million diaspora +75% Rise in global LNG prices since war began A War Thousands of Miles Away — That Hit Home India was not a party to the conflict. Yet geography, energy dependence, and trade linkages made it deeply vulnerable. The Strait of Hormuz — a narrow waterway between Iran and Oman — carries roughly 20 to 30 percent of all global crude oil and liquefied natural gas every single day. When that route was effectively shut down after March 4, 2026, the consequences were immediate and global. For India specifically, the stakes were existential. The country imports over 85% of its crude oil requirements. There is no buffer large enough to absorb a sustained disruption. Within a week of the Strait’s effective closure, Brent crude had surged from approximately $80 per barrel to nearly $120 — a 50% spike that sent ripples across every oil-linked sector in the Indian economy. “The Iran crisis revealed that India is structurally exposed.” — Investment manager quoted by CNBC, April 2026 The Strait of Hormuz carries nearly a quarter of the world’s daily crude oil and LNG supply — its effective closure in March 2026 sent shockwaves across global energy markets, hitting India hardest among emerging economies. The Oil Shock: India’s Most Immediate and Deepest Wound Think of India’s economy as a machine that runs on imported oil. When the fuel gets 50% more expensive overnight, every gear — transportation, manufacturing, food supply chains, electricity generation — starts grinding harder. That is precisely what happened in March 2026. The government moved quickly. Excise duties on petrol and diesel were cut to prevent retail prices from spiking in a way that could trigger social unrest. But this came at a fiscal cost. The fiscal deficit, originally targeted at 4.3% of GDP for the year, was now forecast by economists to swell to 4.7% — and some modeled scenarios as bad as 5%. India’s Balance of Payments deficit, already at $25.2 billion (0.6% of GDP) in 2025–26, was headed sharply wider. India’s credit rating agency Crisil stated plainly that the impact would “reverberate across the economy through higher transport costs, pushing up both food and core inflation.” This wasn’t abstract analysis — it was showing up in vegetable prices, in the cost of logistics for manufacturers, and in the inputs to India’s vast FMCG sector. Oil Shock: Key Numbers Brent crude surged from $80 → $120/barrel within one week of conflict onset Gas prices rose 75% globally over the same period India imports 85%+ of its crude oil requirements India’s BoP deficit forecast to swell to ~$65 billion in 2026–27 (pre-intervention) Post-government measures: deficit expected to improve by ~$30 billion per HSBC What the GDP Numbers Actually Tell Us Before the war began, India’s economy was on track for roughly 7% GDP growth in the financial year ending March 2027. The Chief Economic Adviser himself had projected 7.0–7.4% growth. That number looks different now. Goldman Sachs lowered its India GDP growth estimate by 1.1 percentage points — all the way down to 5.9%. Moody’s aligned closely, with similar revisions to the 5.9–6% range. Both agencies also raised their inflation forecasts: Goldman Sachs raised its CPI projection by 70 basis points. To put that in perspective: a 1% drop in India’s GDP growth is not just a statistical revision. It represents billions of dollars in lost output, slowed job creation, and reduced tax revenues — all of which compound over time. The scenario analysis published in the International Journal of Economics and Finance Management estimated that a medium-term persistence of oil at $100–130 per barrel could cut India’s GDP growth by 0.5–1.5%, weaken the rupee by 5–10%, and escalate fiscal subsidies on energy and fertilizer significantly. Indian markets saw some of the steepest foreign outflows on record in March 2026, as elevated crude prices and geopolitical uncertainty pushed FIIs to exit rapidly. Dalal Street Under Siege: The Sensex and FII Exodus Indian equity markets were one of the fastest and most visible channels through which the war’s impact arrived. Within weeks of the conflict starting, the BSE Sensex fell to around 73,583 — a 2.3% single-session decline on March 27, 2026. The broader market saw over 400 stocks record sharp declines. Goldman Sachs downgraded Indian equities from “overweight” to “market weight,” a symbolic but important signal to global fund managers. Foreign Institutional Investors, who had been cautiously warming up to Indian equities after the India-US trade deal in February, responded to the new uncertainty with an aggressive exit. In just the first two weeks of March 2026, FIIs sold ₹34,000 crore worth of Indian shares. On one particularly brutal Friday, they offloaded ₹5,518 crore in a single session. By end-March, the monthly FII outflow had reached $12 billion — the steepest single-month foreign equity withdrawal in India’s recorded history. Ambit Capital, one of India’s respected

Read More »

Why 90% of F&O Traders in India Lose —It’s Not What You Think

    📉 F&O Deep Dive · Traders Latitude Why 90% of F&O Traders in India Lose —It’s Not What You Think Everyone blames bad stock picks. The real culprits are hiding in plain sight — and they’re costing Indian retail traders thousands of crores every year. 🗓️ June 2026⏱️ 12 min read✍️ Traders Latitude Research Desk📚 Educational & Informational Only 89% Individual F&O traders incur net losses (SEBI, 2023) ₹1.1L Average annual loss per retail trader 93% Of losing traders keep trading the next year anyway Picture this. It’s a Monday morning. Rajesh — a 28-year-old software engineer from Pune — opens his Demat account with ₹2 lakhs he’s been saving for a year. He’s watched a hundred YouTube videos. He has a “system.” He’s confident. By Friday, ₹40,000 is gone. Not because Rajesh picked the wrong stocks. Not because the market crashed. Because of something far more insidious — something neither the YouTube guru nor the telegram channel ever warned him about. Rajesh’s story isn’t unique. According to SEBI’s landmark study on F&O trading, 89% of individual traders in India’s equity futures and options segment lose money. That’s almost nine out of ten. And yet, every month, lakhs of new accounts get activated, new positions get taken, and new losses quietly pile up. So what’s really going on? Why do so many smart, motivated people keep losing in F&O — and why does the conventional wisdom about “bad stock picks” completely miss the point? Let’s go deeper than most articles dare to go. 📌 Note: This article is purely educational and informational in nature. Nothing here constitutes investment advice or a recommendation to buy, sell, or trade any financial instrument. F&O trading involves significant risk. Please consult a SEBI-registered financial advisor before making any trading decisions. First, Let’s Acknowledge the Elephant in the Room There’s a narrative that gets repeated constantly in trading communities: “You lost because you picked the wrong stock” or “You needed a better technical analysis strategy.” This is wrong. Or rather — it’s incomplete in a way that causes enormous harm. The SEBI study didn’t find that 89% of traders have bad analytical skills. What it found was far more structural. The losses come from a web of interconnected factors — psychological, mechanical, and systemic — that most new traders have zero awareness of when they first enter the derivatives market. Think of it like this: imagine you’re playing a card game, but you’ve walked in halfway through, nobody explained the rules properly, the house takes a cut from every pot, and your emotions are whispering bad decisions in your ear every five minutes. It doesn’t matter how smart you are — the odds are heavily stacked against you from the start. That’s F&O for most retail traders in India. The 7 Real Reasons F&O Traders Lose in India After studying market behaviour, trader psychology, and SEBI’s data, here are the actual culprits — ranked not by how dramatic they sound, but by how much damage they actually cause. 1 Theta Decay: The Silent Wealth Destroyer Most retail traders buy options — calls or puts — hoping for a big directional move. What they forget is that options have an expiry date, and every single day that passes, the option loses value due to time decay (Theta). You could be directionally right, but if the move doesn’t come fast enough, you still lose. Theta is essentially a daily tax on option buyers. Institutions and algo traders know this and often sit on the other side, collecting premium. 2 The Leverage Trap Futures trading lets you control a large position with a fraction of the capital — sometimes 5x to 20x exposure on your margin. This sounds wonderful when you’re winning. But leverage is a double-edged sword. A 5% move against your position can wipe out 50–100% of your capital almost instantly. Most traders dramatically underestimate how quickly leverage can destroy an account. 3 Trading Without a Written Plan Ask the average F&O trader to show you their written trading plan — entry rules, exit rules, stop-loss criteria, position sizing formula — and most will go quiet. Trading without a documented system means every decision gets made in the heat of the moment, driven by emotion rather than logic. Research consistently shows that traders with written plans significantly outperform those who trade on intuition alone. 4 The Hidden Cost of Trading (The Real “House Edge”) Every trade has a cost: brokerage, Securities Transaction Tax (STT), exchange transaction charges, GST, SEBI turnover fees, and stamp duty. On F&O trades — especially high-frequency ones — these costs compound aggressively. A trader doing 10 lots of Nifty options daily can easily pay ₹5,000–₹10,000 in transaction costs per month, often without even realising it. This is essentially the market’s “house edge,” and you need to beat these costs before you even start making a profit. 5 Emotional Decision-Making: The Psychology Problem Loss aversion. Revenge trading. Overconfidence after a winning streak. Fear of missing out (FOMO). These aren’t weaknesses of character — they’re hard-wired human psychology. But the market is designed to trigger all of them constantly. The trader who closes a winning position too early (fear of losing the gain) and holds a losing position too long (hoping it’ll recover) is not making rational decisions — they’re following emotional impulses that systematically destroy wealth. 6 Chasing Tips and Social Media Noise India has a thriving ecosystem of trading “gurus,” Telegram channels, and WhatsApp groups peddling daily “calls.” The problem? These tips have zero accountability, no disclosed track record, and often violate SEBI regulations. A tip that works once creates a devoted follower; the losses that follow get blamed on market conditions. Trading based on external tips means you have no understanding of why a trade is taken — which means you can’t manage it intelligently when it goes wrong. 7 Treating F&O Like a Casino, Not a Business The most dangerous mindset in F&O trading is the “lottery

Why 90% of F&O Traders in India Lose —It’s Not What You Think Read More »

Aditya Bothikar SEBI Registered Research Analyst

Who Is Aditya Umakant Bothikar? SEBI Registered Research Analyst & Founder Of Traders Latitude |

Who Is Aditya Umakant Bothikar? SEBI Registered Research Analyst & Founder Of Traders Latitude  Aditya Bothikar is a SEBI Registered Research Analyst (RA) and founder of Traders Latitude, a market research and investor education platform focused on promoting informed participation in financial markets. SEBI Registered Research Analyst (RA) Registration No.: [INH000027399] With an academic background spanning healthcare, finance, and management, Aditya Bothikar focuses on research-oriented market understanding, investor awareness, and structured financial education.. The objective is to simplify market-related concepts and encourage disciplined, informed, and risk-aware participation in the securities market. Educational Background- Aditya Bothikar possesses a multidisciplinary educational background combining analytical, financial, and managerial understanding. Educational qualifications include: –Bachelor’s Degree in Pharmacy –MBA in Finance This combination of education supports a structured approach toward financial market research, communication, and investor awareness Professional Qualifications & Regulatory Framework- Aditya Bothikar is a SEBI Registered Research Analyst (RA) and operates in accordance with the regulatory framework governing research analysts in India. Research and educational communication are approached with emphasis on: Professional qualifications and market-related education have further strengthened understanding of market structure, behavioural finance, and analytical interpretation. Founder Of Traders Latitude- Aditya Bothikar is the founder of Traders Latitude, a market research and educational platform designed to simplify financial market concepts for traders and investors. The platform focuses on educational content, market awareness, and structured understanding of financial markets. Research and educational focus areas include: The objective of Traders Latitude is to bridge the gap between complex market concepts and practical understanding through educational communication. Research Philosophy- Aditya Bothikar believes that informed market participation requires a disciplined, research-oriented, and risk-aware approach. Emphasis is placed on: Risk Management Capital preservation and risk awareness are considered important aspects of responsible market participation. Market Psychology Understanding behavioural biases, emotional decision-making, and investor psychology is considered important for disciplined market participation. Structured Decision-Making Preparation, research, and process-driven thinking are prioritised over emotional or impulsive market reactions. Investor Education Improving financial literacy and promoting informed decision-making remain important focus areas. Research Areas & Market Focus- Research and educational focus includes topics related to: About Traders Latitude- Traders Latitude is a market research and educational platform focused on simplifying financial market concepts through educational content and structured market understanding. The platform aims to support investor awareness and improve understanding of financial markets through research-oriented educational communication. Regulatory Disclosure- Aditya Bothikar is a SEBI Registered Research Analyst (RA).Registration Number: INH000027399 Registration granted by the Securities and Exchange Board of India (SEBI), membership of a SEBI-recognized supervisory body, or certification from NISM does not guarantee performance of the intermediary or assure returns to investors. Disclaimer- This profile is intended solely for informational and educational purposes. Investments in securities markets are subject to market risks. Readers and investors are advised to conduct independent due diligence and understand associated risks before making investment or trading decisions. © Traders Latitude | Founded by Aditya Umakant Bothikar

Who Is Aditya Umakant Bothikar? SEBI Registered Research Analyst & Founder Of Traders Latitude | Read More »

Dimaag Ka Khel: Why Your Mind Is Your Biggest Enemy in Nifty Trading

 Trading Psychology In Nifty Trading: Why Most Traders Lose Money | Why Your Mind Is Your Biggest Enemy in Nifty Trading | Trading Psycology Explained With Daily Life Examples

Trading Psychology: Dimaag Ka Khel — Why Your Mind Is Your Biggest Enemy in Nifty Trading Trading psychology is the real reason most Indian retail traders lose money — not bad charts, not bad tips. Fear, greed, FOMO, and revenge trading explained with real desi examples. 📅 June 2026⏱  7 min read🇮🇳  Indian Markets Trading psychology is the one topic that most Indian traders ignore — and it costs them dearly. You have done all the homework. You have read the charts. You know where the support is. You know where to place your stop-loss. But the moment the trade goes live — something inside you breaks. You either exit too early, hold too long, or add more when you should not. Sound familiar? Welcome to the club. This is not a knowledge problem. This is a trading psychology problem. And in Nifty trading, it kills more accounts than bad setups ever will. Let us talk about what goes on inside a trader’s head — in plain, simple language — with examples from everyday Indian life that you will immediately recognise. 1 Fear of Losing — The Doodh Ka Jala Syndrome You know the saying — doodh ka jala chaas bhi phoonk phoonk ke peeta hai. Once you burn your hand on hot milk, even cold buttermilk feels dangerous. This is exactly what happens after a bad trade. You book a ₹15,000 loss on a Nifty position last Monday. Now, on Tuesday, a perfect setup appears. Everything lines up — breakout, volume, trend. But you hesitate. You keep reducing position size. You enter late. You exit at the first red candle. The trade goes ₹20,000 in profit without you. Real Life Connect Your bhabhi once burnt a roti badly because she looked away. For the next six months, she stood right in front of the tawa, never leaving. Result? She burnt the next one from too much flame. Fear made her overdo it. Same happens in trading — fear makes you over-monitor and over-exit. 2 Greed — “Thoda Aur” Is the Most Expensive Phrase in Trading Greed is not about being a bad person. It is completely natural. But in markets, it is silently deadly. You buy Nifty at 24,500 with a target of 24,700. It reaches 24,700. You think — “abhi aur upar jayega, thoda aur ruk jaata hoon.” It comes back to 24,500. You think — “yaar, loss mein kaise niklu.” It goes to 24,200. Now you are stuck. Real Life Connect Think of a summer mango sale in your local bazaar. The vendor says ₹60 per kilo. You want 2 kilos but think — “kal aur saste milenge.” Next day, the price is ₹80 and the good ones are gone. Waiting for “better” made you get nothing. In trading, the market does not wait for your perfect price. 3 Revenge Trading — The Most Dangerous Trade You Will Ever Take You take a loss. Ego gets hurt. You feel angry at the market. You say to yourself — “abhi double karke nikaalta hoon.” You take a big, aggressive position without any setup. You lose more. You take another. Bigger. Within two hours, your entire week’s gain is gone. This is called Revenge Trading. And it is the number one account killer for Indian retail traders in Nifty and Bank Nifty options. Real Life Connect Imagine losing a carrom match to your cousin. You get so worked up that you start playing sloppily — hitting pieces randomly, not thinking. You lose three more games in a row. The anger made your game worse, not better. Markets are like that cousin. They do not care about your anger. They punish it. “The market is a device for transferring money from the impatient to the patient.” — Warren Buffett. In India, add this: from the emotional to the disciplined. 4 FOMO — Fear of Missing Out, or How WhatsApp Ruins Trades You are sitting peacefully. No trade. Suddenly your trading group pings — “Nifty 50-point move aaya bhai, entry lelo!” You have not analysed anything. You do not know where your stop-loss is. But you jump in anyway because you do not want to miss the party. Market turns. You are trapped. FOMO is the child of social comparison. And in India, between trading Telegram groups, YouTube live streams, and WhatsApp tips — FOMO is fed every single minute of market hours. Real Life Connect Your neighbour Sharma ji bought a plot in 2018 and doubled his money. You feel bad. In 2022, someone tells you about a plot in a new area. You rush, buy it without checking, and it is stuck in a legal dispute. FOMO made you skip the homework. Same thing happens when you enter a trade just because others are in it. 5 Overconfidence — The 5-Day Winning Streak Trap You have had five green days in a row. You start feeling like you have cracked the code. Position size doubles. Rules are relaxed. You skip the stop-loss “just this once.” Then one bad trade wipes out three days of gains in a single session. Markets always find a way to humble the overconfident. Always. Real Life Connect Remember the student who scored 95 in the first two maths tests and stopped studying for the third? Confident se nahi, taiyaari se marks aate hain. A winning streak is not a sign that you are above the market — it is simply a sign that the market was cooperative. The moment it stops cooperating and your process is sloppy, it punishes hard. 6 Anchoring Bias — “Mera Average 24,800 Hai Yaar” You bought Nifty futures at 24,800. It goes to 24,400. Instead of accepting the loss and exiting as planned, you hold on because your mind is “anchored” to the 24,800 number. You want to come back to breakeven before exiting. But the market does not know or care about your cost price. Real Life Connect You bought a smartphone for ₹30,000 two years ago. Today it is worth ₹12,000 in the second-hand market. You refuse to

 Trading Psychology In Nifty Trading: Why Most Traders Lose Money | Why Your Mind Is Your Biggest Enemy in Nifty Trading | Trading Psycology Explained With Daily Life Examples Read More »

How To Read Open Interest In Options Trading: Complete Guide For Beginners

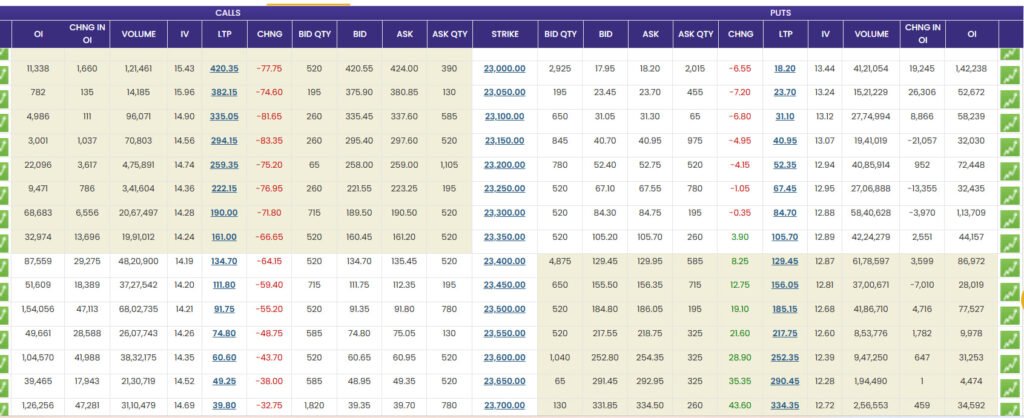
What Is Open Interest In Options Trading? Open Interest (OI) is one of the most important indicators in options trading. It helps traders understand market sentiment, institutional positioning, and potential support or resistance zones. In simple words, open interest represents the total number of active contracts that are currently open in the market and have not been closed or settled. For traders in Nifty, Bank Nifty, and stock options, understanding open interest can improve decision-making and reduce emotional trading.         Many traders struggle to understand open interest in options trading, especially while analysing Bank Nifty and Nifty option chain data. Why Is Open Interest Important? Open interest helps traders understand: Most professional traders use open interest along with price action and volume to make better trading decisions. How To Read Open Interest In Options Trading? Understanding open interest becomes easier when combined with price movement. 1. Price Up + Open Interest Up When price rises and open interest increases, it indicates fresh long positions are being created. Meaning:Bullish sentiment in the market. Example: If Bank Nifty is moving higher and call open interest is increasing with price, buyers may be entering aggressively. 2. Price Down + Open Interest Up When price falls while open interest rises, it usually indicates fresh short positions. Meaning:Bearish sentiment. This often happens during strong selling pressure in indices or stocks. 3. Price Up + Open Interest Down If prices rise but open interest decreases, traders may be covering short positions. Meaning:Short covering rally. Such moves can sometimes be temporary. 4. Price Down + Open Interest Down When both price and open interest decline, long positions are getting closed. Meaning:Long unwinding. This may indicate weakening momentum. How To Use Open Interest In Bank Nifty And Nifty? Many traders use open interest to identify: Call Writing Resistance High call open interest often acts as resistance. Example: If maximum call open interest exists at 25,500 in Bank Nifty, that level may act as resistance. Put Writing Support High put open interest generally acts as support. Example: Heavy put writing at 25,000 may suggest strong support. Common Mistakes While Using Open Interest Many beginners make these mistakes: Ignoring Price Action Open interest alone is not enough. Always combine: Blindly Following OI Data Sometimes large players trap retail traders. Always wait for confirmation. Best Strategy To Use Open Interest A practical method is: Price + OI + Volume Confirmation If: Then probability of trend continuation improves. Final Thoughts Open interest is a powerful tool for traders in options trading, especially in Bank Nifty and Nifty. However, it should never be used alone. Combining open interest with price action, volume, and market structure can significantly improve trading accuracy. For serious traders, learning how to read open interest properly can help identify stronger opportunities and avoid unnecessary trades.     Practical Example Of Open Interest In Bank Nifty Suppose Bank Nifty is trading near an important resistance zone and call option open interest is increasing rapidly at a higher strike price. This may indicate that option writers expect the market to face resistance near that level. Similarly, when put open interest increases at lower strike prices, traders often consider those zones as important support levels. However, traders should always confirm signals using price action and volume before taking any trading decision. Conclusion Open interest is one of the most powerful tools in options trading when used correctly. Understanding how traders are building positions in the market can help identify trend direction, support, resistance, and market sentiment. For traders in Nifty and Bank Nifty, learning open interest analysis can improve confidence and decision-making. However, it should always be used along with technical analysis, volume, and market structure for better accuracy.   Learning open interest in options trading can help improve market understanding and trading confidence.             Traders can monitor live data using the NSE Option Chain. https://www.nseindia.com/option-chain

How To Read Open Interest In Options Trading: Complete Guide For Beginners Read More »